The ichimoku cloud strategy is a technical indicator that uses averages to project future support and resistance levels for the price. It is a complex indicator that can be intimidating for beginner traders, but it offers strong trading signals when used correctly. It can also be complemented by other indicators, such as the RSI or Stochastics, that signal overbought and oversold conditions. This allows you to enter and exit trades during ranging markets.
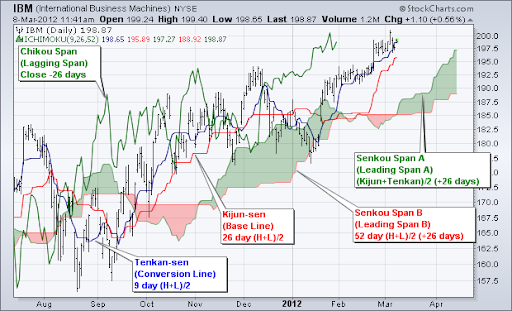
The Ichimoku Cloud is made up of five components, but the most important are the Tenkan-sen and Kijun-sen lines, which act as dynamic support and resistance levels. The space between these two lines is called the cloud and can be colored green in an uptrend or red during a downtrend. The ichimoku cloud is also influenced by Leading Span A, which can be interpreted as a momentum indicator that measures price momentum and trend direction. This component is plotted 26 periods into the future and is a key part of the Ichimoku system because it gives buy and sell signals.
It’s important to understand the Ichimoku system and how it works before you try to use it to trade currencies, stocks or commodities. The indicator shows relevant information about the past, present and future at a glance, which can be confusing for new traders. Each of the indicator’s indications add up to each other, so the more positive Ichimoku signals you get, the more likely it is that prices will move up. The opposite is true for negative Ichimoku signals, which are more likely to predict a downtrend.
In addition to the Tenkan-sen and Kijun-sen line, the Ichimoku Cloud also includes the Lagging Span and Kumo. Traders should look at the color of these lines and where they are on the chart to determine the overall trend direction. The Lagging Span should be above the Kijun-sen and below the Tenkan-sen. If it’s above the kumo, that is a buy signal and it indicates an uptrend. If it is below the kumo, that’s a sell signal and it indicates a downtrend.
Ichimoku can be a powerful tool for both day traders and long-term investors, but it’s essential to pair this indicator with other indicators. Many traders choose to use longer-term moving averages, such as the 50- and 200-day, alongside the Ichimoku cloud to confirm its trading signals. You can also use candlestick chart patterns, such as engulfing and hammer patterns, to identify potential trend reversals or continuations. Using these tools can help you maximize your trading profits with the Ichimoku cloud strategy.


В Москве полицейские задержали мужчину, который нашел потерянный автомобилистом сверток с 1 млн рублей и решил оставить деньги себе. Об этом сообщает ГУ МВД России по столице.
bs2tsite1.cc
В Пресненском районе на одной из парковок вдоль Мантулинской улицы житель столицы положил на крышу своего автомобиля конверт с 1 млн рублей, отвлекся на телефонный разговор, сел за руль и уехал. Упавший на проезжую часть сверток подобрал проходивший мимо мужчина.
مرافق تصنيع إيليت بايب Elite Pipe مجهزة بأحدث الآلات ، مما يتيح عمليات الإنتاج الفعالة وجودة المنتج المتسقة.
child porn
child porn
daxktilogibigibi.8xznLag6nbLK
nxediyunlandayi.fDIlvhzz9ESQ
I was recommended this website by my cousin. I am not sure whether this post is written by him as nobody else know such detailed about my trouble. You are amazing! Thanks!
you are in reality a just right webmaster. The site loading velocity is incredible. It seems that you are doing any unique trick. In addition, The contents are masterwork. you have performed a wonderful task on this topic!
yandanxvurulmus.iSuycrjR5kpI
xyandanxvurulmus.SCDgQyYGOU68
xbunedirloooo.ODFGPPyjn4S1
xyandanxvurulmus.RLCCK9CDdnaS
xyandanxvurulmus.wcNZe3J7N0TN
unbendingness xyandanxvurulmus.drhcqcUaTQPk
Wonderful beat ! I wish to apprentice while you amend your web site, how could i subscribe for a blog web site? The account aided me a acceptable deal. I had been a little bit acquainted of this your broadcast provided bright clear idea
I do believe all the ideas you’ve presented for your post. They are really convincing and will certainly work. Nonetheless, the posts are too short for novices. May just you please lengthen them a little from subsequent time? Thanks for the post.
I loved as much as you will receive carried out right here. The sketch is attractive, your authored material stylish. nonetheless, you command get got an impatience over that you wish be delivering the following. unwell unquestionably come more formerly again since exactly the same nearly a lot often inside case you shield this hike.
of course like your website but you have to check the spelling on several of your posts. A number of them are rife with spelling issues and I in finding it very troublesome to inform the reality on the other hand I will certainly come back again.
Hello my loved one! I want to say that this post is amazing, great written and include almost all significant infos. I would like to look extra posts like this.
Its like you read my mind! You appear to know a lot about this, like you wrote the book in it or something. I think that you could do with some pics to drive the message home a little bit, but instead of that, this is fantastic blog. An excellent read. I will certainly be back.
I am not sure where you’re getting your info, but good topic. I needs to spend some time learning much more or understanding more. Thanks for magnificent info I was looking for this information for my mission.
seks siteleri vurgunyedim.cDM3O0d0LT1K
eskort siteleri yaralandinmieycan.96mAw8wuITj6
When I originally commented I clicked the “Notify me when new comments are added” checkbox and now each time a comment is added I get several emails with the same comment. Is there any way you can remove me from that service? Many thanks!
porn citixx.6tGCqhAOJQe8
fuck google hyuqgzhqt.mqA5SeYuqTJY
bahis siteleri incest category ewrjghsdfaa.w3l3kDUkYTMz
porn siteleri wrtgdfgdfgdqq.JaGB3e3Q9L3C
Mandatory! Appreciate the insights.
Kudos! Your insights have left a lasting impact. Thanks for making this a must-read experience.
Наша бригада искусных специалистов подготовлена предлагать вам перспективные подходы, которые не только подарят надежную оборону от холода, но и подарят вашему коттеджу оригинальный вид.
Мы трудимся с самыми современными материалами, гарантируя долгосрочный срок службы службы и великолепные результаты. Теплоизоляция наружных стен – это не только экономия на обогреве, но и забота о экосистеме. Энергоспасающие инновации, каковые мы используем, способствуют не только твоему, но и поддержанию природных богатств.
Самое ключевое: [url=https://ppu-prof.ru/]Стоимость утепления дома снаружи цена[/url] у нас открывается всего от 1250 рублей за кв. м.! Это бюджетное решение, которое метаморфозирует ваш резиденцию в настоящий комфортный угол с скромными затратами.
Наши работы – это не исключительно изолирование, это созидание поля, в котором любой элемент символизирует ваш особенный модель. Мы примем в расчет все ваши просьбы, чтобы осуществить ваш дом еще более уютным и привлекательным.
Подробнее на [url=https://ppu-prof.ru/]http://www.ppu-prof.ru[/url]
Не откладывайте занятия о своем ларце на потом! Обращайтесь к экспертам, и мы сделаем ваш обиталище не только уютнее, но и по последней моде. Заинтересовались? Подробнее о наших трудах вы можете узнать на нашем сайте. Добро пожаловать в мир комфорта и качественной работы.
pornhub bahis siteleri pompadirha.DAouBKntLAwv
sektor benim zaten amin evladi asillartaklitler.541njYh3En7w
bahis siteleri incest category hephupx.lCM08FjVlXyf
BİZİ SİK BİZ BUNU HAK EDİYORUZ hepxhupx.MbPITyj71RSQ
bahis siteleri sikis juljulfbi.42hrSJiZDbj1
fuck bjluajszz.7kuA4qqWc1Gl
sexx bxjluajsxzz.8oUke48trnbv
porn 0qbxjluaxcxjsxzz.enGdBE2ssOHz
z8a11z
Instagram giriş, Instagram nedir, Instagram Bilgisayar Giriş, Instagram Mobil giriş, Instagram Nedir? hakkında bilgi.
Najlepsza aplikacja do kontroli rodzicielskiej, aby chronić swoje dzieci – potajemnie tajny monitor GPS, SMS-y, połączenia, WhatsApp, Facebook, lokalizacja. Możesz zdalnie monitorować aktywność telefonu komórkowego po pobraniu i zainstalowaniu apk na telefonie docelowym.
I’m impressed by your blog and want to apply as a writer. What steps should I take?
you’re really a excellent webmaster. The web site loading speed is incredible. It seems that you’re doing any unique trick. Also, The contents are masterpiece. you’ve done a fantastic process in this matter!
Дорогие Знакомые!
Представляем вам инновационное слово в мире дизайна внутреннего пространства – шторы плиссе. Если вы аспирируете к превосходству в всякой стороне вашего жилища, то эти сукна превратятся замечательным решением для вас.
Что делает шторы плиссе столькими особенными? Они сочетают в себе в себе изящество, действенность и применимость. Благодаря уникальной архитектуре, современным материалам, шторы плиссе идеально гармонируют с для какого бы то ни пола, будь то стая, койка, кухня или трудовое поляна.
Закажите [url=https://tulpan-pmr.ru]дешевые жалюзи плиссе[/url] – оттворите уют и красочность в вашем доме!
Чем прельщают шторы плиссе для вас? Во-первых, их самобытный декор, который присоединяет к обаяние и вкус вашему декору. Вы можете выискать из различных текстур, расцветок и стилей, чтобы акцентировать особенность вашего дома.
Кроме того, шторы плиссе предлагают многочисленный ряд функциональных вариантов. Они могут регулировать степень света в пространстве, покрывать от солнечного света, обеспечивать закрытость и формировать комфортную среду в вашем доме.
Мы ресурс: [url=https://tulpan-pmr.ru]https://tulpan-pmr.ru[/url]
Мы сами поможем вам подобрать шторы плиссе, какие прекрасно гармонируют с для вашего интерьера!
I’ve been browsing on-line more than 3 hours lately, yet I by no means found any fascinating article like yours. It is beautiful price enough for me. In my opinion, if all site owners and bloggers made just right content material as you probably did, the web might be much more helpful than ever before. “No nation was ever ruined by trade.” by Benjamin Franklin.
I really like what you guys tend to be up too. Such clever work and exposure! Keep up the superb works guys I’ve you guys to blogroll.
Hello! Do you know if they make any plugins to protect against hackers? I’m kinda paranoid about losing everything I’ve worked hard on. Any suggestions?
I view something genuinely interesting about your website so I saved to fav.
Those are yours alright! . We at least need to get these people stealing images to start blogging! They probably just did a image search and grabbed them. They look good though!
Good write-up, I’m regular visitor of one’s site, maintain up the excellent operate, and It’s going to be a regular visitor for a long time.
Hello would you mind letting me know which webhost you’re working with? I’ve loaded your blog in 3 completely different web browsers and I must say this blog loads a lot quicker then most. Can you suggest a good web hosting provider at a honest price? Thank you, I appreciate it!
I simply wanted to compose a simple note to express gratitude to you for all of the unique strategies you are posting on this site. My time consuming internet research has finally been paid with wonderful facts and techniques to share with my classmates and friends. I ‘d suppose that most of us site visitors actually are very much fortunate to live in a magnificent place with very many special people with valuable secrets. I feel rather happy to have seen the website page and look forward to really more amazing moments reading here. Thanks again for everything.
Hey there! I know this is kinda off topic but I was wondering if you knew where I could locate a captcha plugin for my comment form? I’m using the same blog platform as yours and I’m having problems finding one? Thanks a lot!
Howdy, i read your blog occasionally and i own a similar one and i was just curious if you get a lot of spam responses? If so how do you prevent it, any plugin or anything you can suggest? I get so much lately it’s driving me crazy so any assistance is very much appreciated.
hey there and thank you for your info – I have definitely picked up something new from right here. I did however expertise several technical points using this website, as I experienced to reload the website many times previous to I could get it to load correctly. I had been wondering if your hosting is OK? Not that I am complaining, but sluggish loading instances times will often affect your placement in google and can damage your high quality score if advertising and marketing with Adwords. Anyway I’m adding this RSS to my e-mail and can look out for much more of your respective fascinating content. Make sure you update this again soon..
I’m really inspired together with your writing abilities as well as with the structure for your blog. Is that this a paid topic or did you modify it your self? Either way keep up the nice high quality writing, it’s uncommon to look a nice weblog like this one these days..
I’ve been absent for a while, but now I remember why I used to love this web site. Thanks, I will try and check back more frequently. How frequently you update your site?
An attention-grabbing discussion is worth comment. I think that you should write more on this subject, it might not be a taboo topic however generally persons are not sufficient to speak on such topics. To the next. Cheers
Keep working ,fantastic job!
Your resilience is a testament to the power of the human spirit. Thank you for sharing your journey.
Your words of encouragement were just what I needed to hear today. Thank you for your support.
I conceive this site contains some real wonderful information for everyone :D. “The test of every religious, political, or educational system is the man that it forms.” by Henri Frdric Amiel.
Hi there, just become alert to your blog thru Google, and found that it is truly informative. I am gonna be careful for brussels. I’ll be grateful if you continue this in future. A lot of other people shall be benefited out of your writing. Cheers!
Your post reminded me that I am stronger than I think. Thank you for your encouragement.
I know this if off topic but I’m looking into starting my own blog and was curious what all is needed to get set up? I’m assuming having a blog like yours would cost a pretty penny? I’m not very web smart so I’m not 100 certain. Any suggestions or advice would be greatly appreciated. Appreciate it
Along with every thing which appears to be developing throughout this specific subject matter, a significant percentage of perspectives happen to be very refreshing. Having said that, I beg your pardon, because I do not give credence to your entire theory, all be it exhilarating none the less. It appears to everyone that your comments are actually not totally rationalized and in simple fact you are your self not thoroughly certain of your assertion. In any event I did appreciate reading it.
I admire your work, thankyou for all the informative blog posts.
I like this web site very much, Its a real nice office to read and obtain info . “Philosophy is a battle against the bewitchment of our intelligence by means of language.” by Ludwig Wittgenstein.
I genuinely treasure your piece of work, Great post.
Hi there very cool blog!! Man .. Excellent .. Wonderful .. I’ll bookmark your site and take the feeds also…I am satisfied to search out numerous helpful information here in the post, we’d like develop more techniques on this regard, thanks for sharing.
Wow, awesome blog layout! How long have you been blogging for? you make blogging look easy. The overall look of your site is excellent, as well as the content!
Some truly nice stuff on this web site, I love it.
I would like to thnkx for the efforts you have put in writing this blog. I am hoping the same high-grade blog post from you in the upcoming as well. In fact your creative writing abilities has inspired me to get my own blog now. Really the blogging is spreading its wings quickly. Your write up is a good example of it.
best porn 4k gghkyogg.XFJa0LANgxZ
danatoto alternatif link!
Howdy! Do you use Twitter? I’d like to follow you if that would be ok. I’m definitely enjoying your blog and look forward to new updates.
సెక్స్ డౌన్లోడ్ ggjennifegg.Ybdf22SxA3t
Hi my loved one! I wish to say that this post is amazing, great written and include approximately all significant infos. I would like to look extra posts like this .
hd porn sex videos download ggjinnysflogg.LSPs0sOzspM
danatoto alternatif link!
Nice post. I learn something more challenging on different blogs everyday. It will always be stimulating to read content from other writers and practice a little something from their store. I’d prefer to use some with the content on my blog whether you don’t mind. Natually I’ll give you a link on your web blog. Thanks for sharing.
I really like your writing style, wonderful information, thankyou for putting up : D.
Nice blog right here! Also your site quite a bit up very fast! What web host are you the usage of? Can I get your affiliate hyperlink in your host? I wish my site loaded up as fast as yours lol
It is best to participate in a contest for among the best blogs on the web. I will recommend this website!
There is clearly a bundle to realize about this. I feel you made some nice points in features also.
You have brought up a very good details, thanks for the post.
Enjoyed looking through this, very good stuff, thanks. “Curiosity killed the cat, but for a while I was a suspect.” by Steven Wright.
This is a topic close to my heart cheers, where are your contact details though?
Hello.This article was really fascinating, particularly since I was investigating for thoughts on this topic last Sunday.
I will immediately take hold of your rss as I can not in finding your email subscription link or e-newsletter service. Do you’ve any? Please let me realize so that I could subscribe. Thanks.
Great post. I am facing a couple of these problems.
I’d incessantly want to be update on new blog posts on this website , saved to my bookmarks! .
I’ve read a few good stuff here. Definitely worth bookmarking for revisiting. I surprise how much effort you put to make such a excellent informative website.
obviously like your web-site but you have to check the spelling on quite a few of your posts. Many of them are rife with spelling issues and I find it very bothersome to tell the reality however I will surely come back again.
Enjoyed studying this, very good stuff, regards. “It is in justice that the ordering of society is centered.” by Aristotle.
Pretty! This was a really wonderful post. Thank you for your provided information.
I know this if off topic but I’m looking into starting my own weblog and was wondering what all is required to get set up? I’m assuming having a blog like yours would cost a pretty penny? I’m not very web smart so I’m not 100 certain. Any suggestions or advice would be greatly appreciated. Kudos
I am no longer certain where you’re getting your info, but great topic. I must spend some time studying much more or figuring out more. Thanks for great info I was searching for this information for my mission.
excellent post.Never knew this, thanks for letting me know.
I would like to thnkx for the efforts you’ve put in writing this blog. I am hoping the same high-grade site post from you in the upcoming as well. Actually your creative writing skills has encouraged me to get my own site now. Actually the blogging is spreading its wings quickly. Your write up is a good example of it.
Do you mind if I quote a couple of your articles as long as I provide credit and sources back to your blog? My website is in the very same area of interest as yours and my users would definitely benefit from a lot of the information you present here. Please let me know if this ok with you. Thank you!
There may be noticeably a bundle to find out about this. I assume you made sure good factors in features also.
Wholeheartedly agree with the praises above; this post is incredibly enjoyable!
I would like to thnkx for the efforts you have put in writing this blog. I am hoping the same high-grade blog post from you in the upcoming as well. In fact your creative writing abilities has inspired me to get my own blog now. Really the blogging is spreading its wings quickly. Your write up is a good example of it.
Wow! Thank you! I permanently wanted to write on my blog something like that. Can I include a part of your post to my blog?
I like the efforts you have put in this, thanks for all the great blog posts.
I do not even know how I stopped up here, however I thought this publish was once good. I don’t understand who you’re but certainly you’re going to a well-known blogger in case you are not already 😉 Cheers!
Hello, Neat post. There’s an issue along with your website in internet explorer, may test thisK IE still is the marketplace chief and a large component of folks will pass over your fantastic writing because of this problem.
I really appreciate this post. I have been looking everywhere for this! Thank goodness I found it on Bing. You have made my day! Thanks again!
Everyone loves what you guys tend to be up too. This kind of clever work and coverage! Keep up the superb works guys I’ve included you guys to our blogroll.
Loving the information on this website , you have done outstanding job on the posts.
Hi, just required you to know I he added your site to my Google bookmarks due to your layout. But seriously, I believe your internet site has 1 in the freshest theme I??ve came across. It extremely helps make reading your blog significantly easier.
I want to express some appreciation to this writer for bailing me out of this difficulty. Right after searching throughout the the web and obtaining views that were not powerful, I believed my entire life was gone. Being alive minus the strategies to the difficulties you’ve resolved all through your article content is a serious case, as well as the kind that might have in a negative way damaged my career if I hadn’t noticed your web page. The ability and kindness in touching all things was useful. I don’t know what I would’ve done if I had not come upon such a subject like this. It’s possible to at this moment look ahead to my future. Thanks so much for your skilled and result oriented guide. I won’t be reluctant to suggest the website to any individual who ought to have assistance about this matter.
Write more, thats all I have to say. Literally, it seems as though you relied on the video to make your point. You obviously know what youre talking about, why waste your intelligence on just posting videos to your weblog when you could be giving us something enlightening to read?
I conceive you have observed some very interesting details , regards for the post.
Hi there I am so happy I found your webpage, I really found you by error, while I was searching on Digg for something else, Nonetheless I am here now and would just like to say thank you for a remarkable post and a all round entertaining blog (I also love the theme/design), I don’t have time to go through it all at the minute but I have bookmarked it and also added in your RSS feeds, so when I have time I will be back to read much more, Please do keep up the excellent work.
Its like you read my mind! You appear to know a lot about this, like you wrote the book in it or something. I think that you can do with some pics to drive the message home a little bit, but other than that, this is wonderful blog. A fantastic read. I will certainly be back.
I like the helpful info you provide in your articles. I’ll bookmark your weblog and check again here frequently. I am quite certain I’ll learn lots of new stuff right here! Best of luck for the next!
I am continuously browsing online for ideas that can assist me. Thx!
What i do not realize is in fact how you are no longer actually a lot more smartly-preferred than you may be now. You’re very intelligent. You realize therefore significantly when it comes to this subject, produced me personally consider it from numerous numerous angles. Its like men and women aren’t involved unless it is one thing to do with Lady gaga! Your personal stuffs great. All the time care for it up!
What’s Happening i’m new to this, I stumbled upon this I’ve found It positively useful and it has aided me out loads. I hope to give a contribution & help other customers like its aided me. Good job.
After all, what a great site and informative posts, I will upload inbound link – bookmark this web site? Regards, Reader.
Wohh exactly what I was searching for, thankyou for putting up.
hello!,I like your writing so much! share we communicate more about your article on AOL? I require an expert on this area to solve my problem. Maybe that’s you! Looking forward to see you.
I was very pleased to find this web-site.I wanted to thanks for your time for this wonderful read!! I definitely enjoying every little bit of it and I have you bookmarked to check out new stuff you blog post.
I’m truly enjoying the design and layout of your site. It’s a very easy on the eyes which makes it much more pleasant for me to come here and visit more often. Did you hire out a developer to create your theme? Exceptional work!
Thanks a bunch for sharing this with all folks you actually recognize what you are speaking about! Bookmarked. Please also visit my web site =). We could have a link change contract among us!
Hey, you used to write excellent, but the last few posts have been kinda boring?K I miss your great writings. Past several posts are just a little out of track! come on!
hello there and thank you in your info – I have certainly picked up something new from proper here. I did then again expertise several technical points using this website, since I skilled to reload the website lots of occasions previous to I may get it to load correctly. I were thinking about in case your hosting is OK? Not that I’m complaining, however sluggish loading instances times will very frequently impact your placement in google and can injury your high-quality rating if advertising and ***********|advertising|advertising|advertising and *********** with Adwords. Well I’m adding this RSS to my e-mail and can glance out for a lot more of your respective intriguing content. Ensure that you update this again soon..
Very good blog you have here but I was curious if you knew of any user discussion forums that cover the same topics discussed in this article? I’d really love to be a part of group where I can get suggestions from other experienced individuals that share the same interest. If you have any suggestions, please let me know. Kudos!
I like this blog so much, saved to favorites.
I enjoy your writing style really loving this website .
Thanx for the effort, keep up the good work Great work, I am going to start a small Blog Engine course work using your site I hope you enjoy blogging with the popular BlogEngine.net.Thethoughts you express are really awesome. Hope you will right some more posts.
Good write-up, I am regular visitor of one’s website, maintain up the excellent operate, and It is going to be a regular visitor for a lengthy time.
I conceive you have mentioned some very interesting details , regards for the post.
I have recently started a website, the information you provide on this web site has helped me tremendously. Thanks for all of your time & work. “So full of artless jealousy is guilt, It spills itself in fearing to be spilt.” by William Shakespeare.
Howdy would you mind letting me know which hosting company you’re working with? I’ve loaded your blog in 3 completely different internet browsers and I must say this blog loads a lot quicker then most. Can you suggest a good hosting provider at a honest price? Many thanks, I appreciate it!
What¦s Happening i am new to this, I stumbled upon this I’ve discovered It positively helpful and it has aided me out loads. I am hoping to give a contribution & aid other users like its helped me. Great job.
Valuable info. Fortunate me I found your web site by chance, and I am surprised why this accident did not came about in advance! I bookmarked it.
excellent post.Ne’er knew this, regards for letting me know.
naturally like your web-site but you need to test the spelling on quite a few of your posts. A number of them are rife with spelling issues and I to find it very bothersome to inform the truth nevertheless I will certainly come back again.
An impressive share, I just given this onto a colleague who was doing a little analysis on this. And he in fact bought me breakfast because I found it for him.. smile. So let me reword that: Thnx for the treat! But yeah Thnkx for spending the time to discuss this, I feel strongly about it and love reading more on this topic. If possible, as you become expertise, would you mind updating your blog with more details? It is highly helpful for me. Big thumb up for this blog post!
Attractive section of content. I just stumbled upon your blog and in accession capital to assert that I acquire in fact enjoyed account your blog posts. Anyway I’ll be subscribing to your augment and even I achievement you access consistently rapidly.
Some times its a pain in the ass to read what blog owners wrote but this internet site is rattling user pleasant! .
It’s a pity you don’t have a donate button! I’d certainly donate to this excellent blog! I suppose for now i’ll settle for book-marking and adding your RSS feed to my Google account. I look forward to new updates and will talk about this site with my Facebook group. Chat soon!
You have brought up a very superb details, thanks for the post.
You are my intake, I have few blogs and often run out from to post .
Only a smiling visitant here to share the love (:, btw outstanding layout. “He profits most who serves best.” by Arthur F. Sheldon.
Terrific work! This is the type of information that should be shared around the internet. Shame on Google for not positioning this post higher! Come on over and visit my site . Thanks =)
I like the efforts you have put in this, regards for all the great content.
Admiring the dedication you put into your website and detailed information you offer. It’s good to come across a blog every once in a while that isn’t the same out of date rehashed information. Great read! I’ve bookmarked your site and I’m adding your RSS feeds to my Google account.
Some genuinely quality posts on this internet site, saved to favorites.
you are truly a excellent webmaster. The site loading speed is amazing. It kind of feels that you are doing any distinctive trick. Furthermore, The contents are masterwork. you have performed a wonderful job on this subject!
Hello There. I found your blog using msn. This is a very well written article. I’ll make sure to bookmark it and return to read more of your useful information. Thanks for the post. I will certainly comeback.
I think that is one of the most vital info for me. And i am satisfied studying your article. But should remark on some basic issues, The website style is ideal, the articles is really great : D. Good process, cheers
I’ve been exploring for a little bit for any high quality articles or weblog posts on this sort of house . Exploring in Yahoo I eventually stumbled upon this website. Studying this info So i’m happy to exhibit that I’ve a very excellent uncanny feeling I found out exactly what I needed. I most indubitably will make sure to don’t forget this web site and provides it a glance regularly.
I was reading some of your articles on this internet site and I believe this web site is rattling informative! Keep on posting.
Very good written article. It will be supportive to everyone who utilizes it, including me. Keep doing what you are doing – can’r wait to read more posts.
It’s really a cool and helpful piece of information. I’m glad that you shared this useful info with us. Please keep us up to date like this. Thanks for sharing.
You made some decent factors there. I looked on the internet for the difficulty and located most people will go along with together with your website.
Мы компания специалистов по продвижению в интернете, специализирующихся на увеличении трафика и повышении рейтинга вашего сайта в поисковых системах.
Наша команда добились впечатляющих результатов и стремимся передать вам наши знания и опыт.
Какие выгоды ждут вас:
• [url=https://seo-prodvizhenie-ulyanovsk1.ru/]профессиональный аудит сайта[/url]
• Полный аудит вашего сайта и создание индивидуальной стратегии продвижения.
• Модернизация контента и технических аспектов вашего сайта для оптимальной работы.
• Регулярный анализ результатов и мониторинг вашего онлайн-присутствия для его улучшения.
Подробнее [url=https://seo-prodvizhenie-ulyanovsk1.ru/]https://seo-prodvizhenie-ulyanovsk1.ru/[/url]
Многие наши клиенты отмечают улучшения: увеличение трафика, улучшение рейтинга в поисковых системах и, конечно, увеличение прибыли. Мы готовы предоставить вам бесплатную консультацию, для того чтобы обсудить ваши требования и разработать стратегию продвижения, соответствующую вашим целям и финансовым возможностям.
Не упустите возможность улучшить свой бизнес в онлайн-мире. Обратитесь к нам немедленно.
As I website possessor I conceive the written content here is really wonderful, thanks for your efforts.
wonderful post, very informative. I wonder why the other experts of this sector do not notice this. You must continue your writing. I am sure, you have a huge readers’ base already!
I discovered your blog site on google and check a few of your early posts. Continue to keep up the very good operate. I just additional up your RSS feed to my MSN News Reader. Seeking forward to reading more from you later on!…
I am no longer sure where you are getting your information, however good topic. I must spend a while studying more or working out more. Thank you for fantastic information I was on the lookout for this info for my mission.
very good submit, i certainly love this website, carry on it
Hello my friend! I wish to say that this post is amazing, nice written and include approximately all significant infos. I¦d like to peer more posts like this .
Exceptional post but I was wondering if you could write a litte more on this subject? I’d be very grateful if you could elaborate a little bit further. Cheers!
Hello.This post was extremely motivating, especially because I was searching for thoughts on this matter last couple of days.
Very great post. I simply stumbled upon your weblog and wanted to mention that I’ve really loved surfing around your blog posts. After all I’ll be subscribing on your feed and I’m hoping you write once more soon!
remarkable day commencing with a phenomenal literature 📘🌄
Lovely just what I was looking for.Thanks to the author for taking his clock time on this one.
naturally like your web site but you have to check the spelling on quite a few of your posts. Many of them are rife with spelling problems and I find it very troublesome to tell the truth nevertheless I will definitely come back again.
hello!,I like your writing so much! share we communicate more about your post on AOL? I require a specialist on this area to solve my problem. Maybe that’s you! Looking forward to see you.
Merely wanna remark on few general things, The website design and style is perfect, the written content is real fantastic : D.
Hello my loved one! I want to say that this post is awesome, nice written and come with approximately all important infos. I?¦d like to peer extra posts like this .
I’ve read some good stuff here. Certainly worth bookmarking for revisiting. I surprise how much effort you put to make such a excellent informative site.
This is a very good tips especially to those new to blogosphere, brief and accurate information… Thanks for sharing this one. A must read article.
I really like your writing style, great information, regards for putting up :D. “I will show you fear in a handful of dust.” by T. S. Eliot.
I like what you guys are up also. Such smart work and reporting! Keep up the excellent works guys I have incorporated you guys to my blogroll. I think it’ll improve the value of my site 🙂
I’m really inspired along with your writing abilities and also with the layout on your blog. Is that this a paid theme or did you customize it yourself? Either way stay up the excellent quality writing, it’s rare to peer a great weblog like this one these days..
I have not checked in here for some time since I thought it was getting boring, but the last few posts are good quality so I guess I will add you back to my everyday bloglist. You deserve it my friend 🙂
Regards for helping out, good info. “Riches cover a multitude of woes.” by Menander.
You got a very wonderful website, Gladiola I found it through yahoo.
Sweet blog! I found it while browsing on Yahoo News. Do you have any suggestions on how to get listed in Yahoo News? I’ve been trying for a while but I never seem to get there! Cheers
I’ve been browsing online more than three hours today, yet I never found any fascinating article like yours. It?¦s pretty value enough for me. In my opinion, if all webmasters and bloggers made just right content material as you probably did, the web will be much more useful than ever before.
I carry on listening to the rumor speak about receiving boundless online grant applications so I have been looking around for the most excellent site to get one. Could you advise me please, where could i get some?
fashionflag pron videos download hd fashionflag.5ZnFFAnX9EE
Only wanna remark that you have a very nice website , I love the style and design it actually stands out.
Hey there I am so grateful I found your website, I really found you by accident, while I was looking on Askjeeve for something else, Anyhow I am here now and would just like to say thanks a lot for a marvelous post and a all round entertaining blog (I also love the theme/design), I don’t have time to look over it all at the moment but I have bookmarked it and also added your RSS feeds, so when I have time I will be back to read more, Please do keep up the fantastic job.
Great – I should certainly pronounce, impressed with your web site. I had no trouble navigating through all tabs as well as related info ended up being truly easy to do to access. I recently found what I hoped for before you know it at all. Reasonably unusual. Is likely to appreciate it for those who add forums or something, website theme . a tones way for your customer to communicate. Excellent task.
You have brought up a very great details , appreciate it for the post.
Terrific post but I was wondering if you could write a litte more on this subject? I’d be very grateful if you could elaborate a little bit further. Many thanks!
I really like what you guys are up too. This sort of clever work and coverage! Keep up the great works guys I’ve included you guys to our blogroll.
Awsome site! I am loving it!! Will be back later to read some more. I am bookmarking your feeds also
Thank you a bunch for sharing this with all of us you really understand what you’re talking approximately! Bookmarked. Kindly also visit my website =). We may have a link alternate arrangement between us!
Well I truly liked reading it. This tip offered by you is very useful for good planning.
I like what you guys are up also. Such clever work and reporting! Keep up the superb works guys I?¦ve incorporated you guys to my blogroll. I think it’ll improve the value of my site 🙂
I think you have mentioned some very interesting points, thanks for the post.
Excellent goods from you, man. I have understand your stuff previous to and you are just extremely wonderful. I actually like what you’ve acquired here, really like what you are saying and the way in which you say it. You make it entertaining and you still care for to keep it smart. I can’t wait to read far more from you. This is really a wonderful site.
I do agree with all the ideas you’ve presented on your post. They are really convincing and will certainly work. Nonetheless, the posts are too quick for beginners. May just you please prolong them a little from next time? Thank you for the post.
Great work! That is the kind of info that should be shared across the net. Disgrace on Google for not positioning this submit upper! Come on over and talk over with my website . Thanks =)
Well I sincerely enjoyed reading it. This information procured by you is very helpful for good planning.
I am now not sure the place you are getting your information, but good topic. I needs to spend a while learning more or understanding more. Thank you for magnificent information I was in search of this information for my mission.
I gotta favorite this site it seems very helpful extremely helpful
There is noticeably a bundle to know about this. I assume you made certain nice points in features also.
Woah! I’m really enjoying the template/theme of this website. It’s simple, yet effective. A lot of times it’s very difficult to get that “perfect balance” between user friendliness and visual appeal. I must say you have done a awesome job with this. Also, the blog loads very fast for me on Firefox. Superb Blog!
I would like to thnkx for the efforts you’ve put in writing this website. I’m hoping the same high-grade site post from you in the upcoming as well. Actually your creative writing abilities has encouraged me to get my own web site now. Actually the blogging is spreading its wings quickly. Your write up is a good example of it.
Everything is very open and very clear explanation of issues. was truly information. Your website is very useful. Thanks for sharing.
Hello.This article was extremely motivating, particularly because I was investigating for thoughts on this issue last couple of days.
you’ve gotten an awesome blog right here! would you wish to make some invite posts on my weblog?
I am glad to be one of many visitants on this great internet site (:, appreciate it for putting up.
Have you ever considered publishing an e-book or guest authoring on other websites? I have a blog centered on the same subjects you discuss and would really like to have you share some stories/information. I know my visitors would value your work. If you’re even remotely interested, feel free to shoot me an e mail.
I am not very good with English but I find this real easy to read .
I have been reading out some of your posts and i must say nice stuff. I will make sure to bookmark your website.
Whats up! I simply would like to give an enormous thumbs up for the good info you’ve gotten right here on this post. I will be coming again to your blog for more soon.
Great write-up, I¦m normal visitor of one¦s blog, maintain up the nice operate, and It is going to be a regular visitor for a long time.
I envy your piece of work, regards for all the interesting articles.
so much fantastic info on here, : D.
I simply could not depart your web site before suggesting that I actually loved the standard information a person provide for your guests? Is going to be again frequently in order to check up on new posts.
wonderful post, very informative. I wonder why the other specialists of this sector do not notice this. You should continue your writing. I’m sure, you’ve a great readers’ base already!
Magnificent beat ! I wish to apprentice at the same time as you amend your web site, how can i subscribe for a blog site? The account aided me a applicable deal. I were tiny bit acquainted of this your broadcast provided vibrant transparent concept
I am constantly thought about this, thanks for putting up.
I have read several good stuff here. Definitely worth bookmarking for revisiting. I wonder how much effort you put to create such a fantastic informative website.
Hey very nice blog!! Man .. Excellent .. Amazing .. I will bookmark your web site and take the feeds also…I am happy to find so many useful information here in the post, we need develop more strategies in this regard, thanks for sharing. . . . . .
Some really fantastic work on behalf of the owner of this web site, utterly great articles.
Thank you for sharing with us, I think this website really stands out : D.
Good ?V I should definitely pronounce, impressed with your web site. I had no trouble navigating through all the tabs as well as related info ended up being truly simple to do to access. I recently found what I hoped for before you know it in the least. Quite unusual. Is likely to appreciate it for those who add forums or anything, website theme . a tones way for your client to communicate. Excellent task..
I truly appreciate this post. I have been looking all over for this! Thank goodness I found it on Bing. You’ve made my day! Thanks again
Wow, fantastic blog layout! How long have you been blogging for? you made blogging look easy. The overall look of your site is magnificent, let alone the content!
Very interesting details you have observed, appreciate it for putting up. “Jive Lady Just hang loose blood. She gonna handa your rebound on the med side.” by Airplane.
An impressive share, I just given this onto a colleague who was doing a little analysis on this. And he in fact bought me breakfast because I found it for him.. smile. So let me reword that: Thnx for the treat! But yeah Thnkx for spending the time to discuss this, I feel strongly about it and love reading more on this topic. If possible, as you become expertise, would you mind updating your blog with more details? It is highly helpful for me. Big thumb up for this blog post!
I saw a lot of website but I think this one has got something special in it in it
You must take part in a contest for one of the best blogs on the web. I will recommend this website!
sandyterrace.com
황실에서 가장 중요한 것은 고압적인 자세를 유지하는 것입니다.
Thank you for sharing superb informations. Your web-site is so cool. I am impressed by the details that you have on this web site. It reveals how nicely you perceive this subject. Bookmarked this web page, will come back for extra articles. You, my pal, ROCK! I found simply the information I already searched everywhere and simply could not come across. What a perfect site.
Can I just say what a relief to find someone who actually knows what theyre talking about on the internet. You definitely know how to bring an issue to light and make it important. More people need to read this and understand this side of the story. I cant believe youre not more popular because you definitely have the gift.
Woh I enjoy your blog posts, saved to favorites! .
I love it when people come together and share opinions, great blog, keep it up.
What is FitSpresso? FitSpresso, a dietary supplement presented in pill form, offers a comprehensive approach to weight loss by enhancing metabolism and augmenting the body’s fat-burning capacity
I’ve been absent for a while, but now I remember why I used to love this website. Thanks, I?¦ll try and check back more often. How frequently you update your web site?
What Is Puravive? Puravive is a natural formula that supports healthy weight loss. This supplement helps to ignite the levels of brown adipose tissue in the body to lose extra weight
I am often to blogging and i really appreciate your content. The article has really peaks my interest. I am going to bookmark your site and keep checking for new information.
Dead composed content material, Really enjoyed studying.
I discovered your blog site on google and check a few of your early posts. Continue to keep up the very good operate. I just additional up your RSS feed to my MSN News Reader. Seeking forward to reading more from you later on!…
Excellent site. Lots of useful info here. I¦m sending it to some friends ans additionally sharing in delicious. And of course, thanks in your sweat!
I real lucky to find this website on bing, just what I was looking for : D besides bookmarked.
I want to show my affection for your kindness in support of folks who absolutely need guidance on this particular subject matter. Your personal dedication to passing the message all-around had become especially significant and has continually helped people much like me to reach their aims. Your entire invaluable instruction implies a whole lot to me and especially to my fellow workers. With thanks; from everyone of us.
Your style is so unique compared to many other people. Thank you for publishing when you have the opportunity,Guess I will just make this bookmarked.2
Appreciating the persistence you put into your website and detailed information you present. It’s awesome to come across a blog every once in a while that isn’t the same old rehashed information. Fantastic read! I’ve saved your site and I’m including your RSS feeds to my Google account.
you have a great blog here! would you like to make some invite posts on my blog?
You made some nice points there. I looked on the internet for the subject matter and found most individuals will go along with with your website.
What Is Tonic Greens? Tonic Greens is a wellness aid that helps with combatting herpes in addition to enhancing your well-being
What Is DentiCore? DentiCore is an oral health supplement that is made using some of the best and highest quality ingredients
You are my aspiration, I own few web logs and occasionally run out from to post .
Good post. I learn one thing tougher on different blogs everyday. It should at all times be stimulating to learn content from different writers and practice a bit one thing from their store. I’d want to use some with the content material on my blog whether or not you don’t mind. Natually I’ll provide you with a link on your internet blog. Thanks for sharing.
The next time I read a blog, I hope that it doesnt disappoint me as much as this one. I mean, I know it was my choice to read, but I actually thought youd have something interesting to say. All I hear is a bunch of whining about something that you could fix if you werent too busy looking for attention.
Excellent website. A lot of useful info here. I am sending it to several pals ans also sharing in delicious. And obviously, thanks in your sweat!
Hmm it seems like your site ate my first comment (it was super long) so I guess I’ll just sum it up what I had written and say, I’m thoroughly enjoying your blog. I as well am an aspiring blog blogger but I’m still new to the whole thing. Do you have any recommendations for beginner blog writers? I’d definitely appreciate it.
I enjoy reading and I believe this website got some genuinely useful stuff on it! .
You made certain fine points there. I did a search on the subject and found nearly all persons will consent with your blog.
Very fantastic information can be found on web site. “The quality of an organization can never exceed the quality of the minds that make it up.” by Harold R. McAlindon.
I appreciate your work, appreciate it for all the useful blog posts.
You made some clear points there. I did a search on the subject and found most guys will approve with your blog.
I gotta favorite this web site it seems very beneficial invaluable
Hi there, just became aware of your blog through Google, and found that it is really informative. I am gonna watch out for brussels. I will be grateful in case you continue this in future. Numerous people will be benefited from your writing. Cheers!
Thanks for all of the effort on this site. My mom loves getting into research and it’s simple to grasp why. My partner and i hear all relating to the dynamic form you render advantageous tips and hints by means of the website and as well inspire contribution from others on that topic so our favorite child is really becoming educated a lot of things. Take advantage of the rest of the year. You’re the one doing a dazzling job.
I like this web blog so much, bookmarked.
You have mentioned very interesting details! ps nice site. “‘Tis a sharp medicine, but it will cure all that ails you. — last words before his beheadding” by Sir Walter Raleigh.
Hello there, You have done an excellent job. I’ll certainly digg it and personally suggest to my friends. I’m sure they’ll be benefited from this site.
Hi would you mind letting me know which webhost you’re using? I’ve loaded your blog in 3 completely different browsers and I must say this blog loads a lot faster then most. Can you recommend a good hosting provider at a honest price? Cheers, I appreciate it!
Great post. I am facing a couple of these problems.
You have noted very interesting details! ps decent web site.
I simply had to thank you so much all over again. I’m not certain what I would’ve made to happen without these hints documented by you about such subject. It has been an absolute alarming crisis for me, however , witnessing this skilled approach you dealt with it took me to cry over happiness. Now i’m happy for your advice and wish you know what an amazing job you are always putting in teaching others through the use of your blog post. I am sure you have never met any of us.
I do trust all the ideas you’ve presented for your post. They’re really convincing and can certainly work. Still, the posts are too quick for starters. Could you please prolong them a little from subsequent time? Thank you for the post.
Thankyou for all your efforts that you have put in this. very interesting information.
Howdy! Would you mind if I share your blog with my zynga group? There’s a lot of folks that I think would really enjoy your content. Please let me know. Thank you
Hiya, I am really glad I have found this info. Nowadays bloggers publish just about gossips and net and this is actually annoying. A good website with exciting content, that’s what I need. Thank you for keeping this web-site, I’ll be visiting it. Do you do newsletters? Can’t find it.
Hi, I think your site might be having browser compatibility issues. When I look at your website in Safari, it looks fine but when opening in Internet Explorer, it has some overlapping. I just wanted to give you a quick heads up! Other then that, fantastic blog!
When I originally commented I clicked the -Notify me when new comments are added- checkbox and now each time a comment is added I get four emails with the same comment. Is there any way you can remove me from that service? Thanks!
I do trust all of the ideas you have presented on your post. They’re very convincing and will certainly work. Still, the posts are too quick for starters. May just you please lengthen them a bit from next time? Thanks for the post.
Those are yours alright! . We at least need to get these people stealing images to start blogging! They probably just did a image search and grabbed them. They look good though!
It is truly a nice and helpful piece of information. I?¦m happy that you just shared this useful information with us. Please stay us informed like this. Thanks for sharing.
Hmm is anyone else having problems with the pictures on this blog loading? I’m trying to determine if its a problem on my end or if it’s the blog. Any feed-back would be greatly appreciated.
This website is my breathing in, real excellent style and design and perfect subject material.
Wonderful website. A lot of helpful information here. I’m sending it to a few friends ans additionally sharing in delicious. And of course, thanks on your sweat!
Wow, superb blog layout! How lengthy have you ever been blogging for? you make blogging glance easy. The entire look of your site is fantastic, let alone the content material!
Super-Duper website! I am loving it!! Will come back again. I am bookmarking your feeds also.
I will right away grab your rss as I can’t find your e-mail subscription link or newsletter service. Do you have any? Kindly let me know in order that I could subscribe. Thanks.
I was curious if you ever considered changing the layout of your blog? Its very well written; I love what youve got to say. But maybe you could a little more in the way of content so people could connect with it better. Youve got an awful lot of text for only having one or 2 images. Maybe you could space it out better?
Yeah bookmaking this wasn’t a high risk conclusion great post! .
I’m still learning from you, while I’m trying to achieve my goals. I absolutely enjoy reading everything that is written on your website.Keep the stories coming. I enjoyed it!
We’re a group of volunteers and opening a new scheme in our community. Your website offered us with valuable information to work on. You’ve done a formidable job and our whole community will be grateful to you.
hello there and thank you for your info – I have definitely picked up something new from right here. I did however expertise a few technical issues using this website, since I experienced to reload the site a lot of times prior to I could get it to load properly. I were puzzling over in case your web hosting is OK? No longer that I’m complaining, but slow loading circumstances occasions will often affect your placement in google and could damage your quality ranking if advertising and ***********|advertising|advertising|advertising and *********** with Adwords. Well I’m including this RSS to my email and can look out for much extra of your respective fascinating content. Ensure that you replace this again soon..
Those are yours alright! . We at least need to get these people stealing images to start blogging! They probably just did a image search and grabbed them. They look good though!
Whats up very nice website!! Guy .. Excellent .. Amazing .. I will bookmark your web site and take the feeds additionallyKI’m happy to seek out numerous useful information here in the put up, we’d like develop more techniques on this regard, thank you for sharing. . . . . .
Wow! Thank you! I always wanted to write on my website something like that. Can I include a part of your post to my blog?
you’re really a excellent webmaster. The web site loading velocity is amazing. It seems that you’re doing any unique trick. Furthermore, The contents are masterpiece. you’ve performed a wonderful task in this subject!
I have not checked in here for a while since I thought it was getting boring, but the last several posts are good quality so I guess I¦ll add you back to my daily bloglist. You deserve it my friend 🙂
Hello! This is my 1st comment here so I just wanted to give a quick shout out and say I truly enjoy reading through your articles. Can you recommend any other blogs/websites/forums that go over the same topics? Thank you so much!
F*ckin’ remarkable issues here. I am very glad to see your post. Thanks a lot and i’m looking ahead to touch you. Will you please drop me a e-mail?
Wow! Thank you! I constantly wanted to write on my website something like that. Can I take a portion of your post to my site?
Normally I do not read article on blogs, but I would like to say that this write-up very forced me to try and do so! Your writing style has been amazed me. Thanks, quite nice post.
Dead indited content material, Really enjoyed reading.
I think you have observed some very interesting points, thanks for the post.
I savour, result in I discovered exactly what I was having a look for. You’ve ended my 4 day long hunt! God Bless you man. Have a nice day. Bye
I want gathering useful information , this post has got me even more info! .
Your place is valueble for me. Thanks!…
I have read some good stuff here. Certainly price bookmarking for revisiting. I surprise how so much effort you put to create such a great informative site.
It is perfect time to make some plans for the future and it is time to be happy. I have read this post and if I could I want to suggest you some interesting things or tips. Perhaps you can write next articles referring to this article. I want to read even more things about it!
Акумулятори Li-ion Найкраща Ціна Купити недорого (098) 225 51 11 Магазин Li-ion акумуляторів та станцій Акумулятори для FPV Дронів Акумуляторні збірки Портативні електростанції
Dead composed subject matter, Really enjoyed studying.
Nice read, I just passed this onto a friend who was doing a little research on that. And he actually bought me lunch as I found it for him smile Therefore let me rephrase that: Thank you for lunch! “Life is a continual upgrade.” by J. Mark Wallace.
This website online is really a stroll-through for all of the data you wished about this and didn’t know who to ask. Glimpse here, and you’ll definitely uncover it.
Superb website you have here but I was curious about if you knew of any forums that cover the same topics talked about in this article? I’d really like to be a part of online community where I can get responses from other knowledgeable individuals that share the same interest. If you have any recommendations, please let me know. Thanks!
Hi there, I found your website via Google while looking for a related topic, your web site came up, it looks good. I have bookmarked it in my google bookmarks.
Some genuinely nice and utilitarian info on this website , likewise I think the style and design has wonderful features.
What i don’t understood is if truth be told how you are now not really much more well-preferred than you might be now. You are so intelligent. You know thus significantly relating to this matter, made me individually consider it from so many various angles. Its like men and women don’t seem to be interested except it is something to do with Lady gaga! Your individual stuffs outstanding. Always deal with it up!
Very nice post and right to the point. I am not sure if this is really the best place to ask but do you guys have any ideea where to employ some professional writers? Thanks in advance 🙂
Aw, this was a really nice post. In thought I would like to put in writing like this additionally – taking time and precise effort to make an excellent article… but what can I say… I procrastinate alot and on no account seem to get one thing done.
I’m still learning from you, while I’m making my way to the top as well. I certainly liked reading all that is written on your blog.Keep the tips coming. I liked it!
Some truly good content on this internet site, thankyou for contribution.
I gotta bookmark this site it seems extremely helpful handy
It is really a great and helpful piece of information. I am glad that you just shared this helpful info with us. Please stay us informed like this. Thanks for sharing.
What Is FitSpresso? It is a nutritional formula that is produced by the Natures Formulas.
This site can be a stroll-through for all of the info you needed about this and didn’t know who to ask. Glimpse right here, and also you’ll positively uncover it.
Dead composed content material, appreciate it for entropy.
It’s hard to search out educated individuals on this matter, however you sound like you realize what you’re talking about! Thanks
Wow, marvelous weblog format! How long have you been blogging for? you made blogging look easy. The overall look of your website is fantastic, as smartly as the content material!
I have been exploring for a little for any high quality articles or blog posts on this sort of area . Exploring in Yahoo I at last stumbled upon this web site. Reading this info So i am happy to convey that I have a very good uncanny feeling I discovered just what I needed. I most certainly will make sure to don’t forget this site and give it a glance regularly.
I know this if off topic but I’m looking into starting my own blog and was curious what all is required to get set up? I’m assuming having a blog like yours would cost a pretty penny? I’m not very internet smart so I’m not 100 positive. Any recommendations or advice would be greatly appreciated. Cheers
I was reading some of your articles on this site and I believe this website is rattling informative! Keep putting up.
I discovered your weblog website on google and verify a couple of of your early posts. Proceed to keep up the superb operate. I simply additional up your RSS feed to my MSN Information Reader. In search of forward to reading extra from you afterward!…
Thank you a bunch for sharing this with all folks you actually recognise what you are talking approximately! Bookmarked. Please additionally seek advice from my site =). We can have a hyperlink exchange contract between us!
Write more, thats all I have to say. Literally, it seems as though you relied on the video to make your point. You definitely know what youre talking about, why throw away your intelligence on just posting videos to your weblog when you could be giving us something informative to read?
I like this web site because so much utile material on here : D.
Everyone loves what you guys are up too. This type of clever work and coverage! Keep up the fantastic works guys I’ve incorporated you guys to blogroll.
Excellent read, I just passed this onto a friend who was doing a little research on that. And he just bought me lunch as I found it for him smile So let me rephrase that: Thanks for lunch! “To be 70 years young is sometimes far more cheerful and hopeful than to be 40 years old.” by Oliver Wendell Holmes.
Unquestionably imagine that which you said. Your favorite reason seemed to be at the net the simplest thing to be aware of. I say to you, I certainly get annoyed at the same time as folks think about issues that they just don’t realize about. You controlled to hit the nail upon the top and also defined out the whole thing without having side effect , other people could take a signal. Will probably be back to get more. Thank you
I’d have to examine with you here. Which is not one thing I usually do! I take pleasure in reading a post that may make folks think. Additionally, thanks for permitting me to comment!
Greetings from Los angeles! I’m bored to tears at work so I decided to browse your site on my iphone during lunch break. I enjoy the info you provide here and can’t wait to take a look when I get home. I’m surprised at how quick your blog loaded on my mobile .. I’m not even using WIFI, just 3G .. Anyhow, awesome blog!
Appreciate it for this wonderful post, I am glad I discovered this internet site on yahoo.
But wanna comment on few general things, The website design is perfect, the content is very wonderful : D.
I see something really special in this internet site.
Hiya very cool blog!! Man .. Beautiful .. Wonderful .. I’ll bookmark your website and take the feeds also…I’m glad to search out so many useful info here within the submit, we want develop extra strategies on this regard, thanks for sharing. . . . . .
It?¦s actually a nice and useful piece of information. I?¦m happy that you shared this helpful info with us. Please stay us informed like this. Thanks for sharing.
I have recently started a web site, the info you provide on this site has helped me tremendously. Thank you for all of your time & work.
When I initially commented I clicked the “Notify me when new comments are added” checkbox and now each time a comment is added I get three emails with the same comment. Is there any way you can remove me from that service? Cheers!
You made several nice points there. I did a search on the matter and found mainly folks will go along with with your blog.
This is a very good tips especially to those new to blogosphere, brief and accurate information… Thanks for sharing this one. A must read article.
I am glad to be a visitant of this consummate blog! , appreciate it for this rare info ! .
Hey there are using WordPress for your blog platform? I’m new to the blog world but I’m trying to get started and set up my own. Do you require any html coding expertise to make your own blog? Any help would be greatly appreciated!
There is noticeably a bundle to know about this. I assume you made certain nice points in features also.
Your place is valueble for me. Thanks!…
Awsome info and straight to the point. I am not sure if this is really the best place to ask but do you guys have any thoughts on where to employ some professional writers? Thx 🙂
Hey there! I could have sworn I’ve been to this site before but after reading through some of the post I realized it’s new to me. Anyhow, I’m definitely happy I found it and I’ll be bookmarking and checking back frequently!
Howdy very nice website!! Guy .. Beautiful .. Amazing .. I’ll bookmark your website and take the feeds additionally…I’m glad to search out numerous helpful information right here within the put up, we’d like work out more techniques on this regard, thank you for sharing.
I truly appreciate this post. I have been looking all over for this! Thank goodness I found it on Bing. You have made my day! Thx again!
Howdy! Do you know if they make any plugins to safeguard against hackers? I’m kinda paranoid about losing everything I’ve worked hard on. Any tips?
You can certainly see your skills within the paintings you write. The arena hopes for more passionate writers such as you who aren’t afraid to mention how they believe. All the time follow your heart. “The most profound joy has more of gravity than of gaiety in it.” by Michel de Montaigne.
You really make it seem so easy together with your presentation but I in finding this topic to be really one thing that I feel I would by no means understand. It kind of feels too complicated and very wide for me. I am looking ahead in your subsequent post, I¦ll try to get the hold of it!
Hey I am so happy I found your web site, I really found you by error, while I was searching on Aol for something else, Anyways I am here now and would just like to say thanks a lot for a remarkable post and a all round exciting blog (I also love the theme/design), I don’t have time to go through it all at the moment but I have book-marked it and also added in your RSS feeds, so when I have time I will be back to read a great deal more, Please do keep up the superb work.
Hello.This post was really motivating, particularly because I was searching for thoughts on this issue last Monday.
I really like your blog.. very nice colors & theme. Did you create this website yourself or did you hire someone to do it for you? Plz reply as I’m looking to create my own blog and would like to find out where u got this from. many thanks
very good publish, i certainly love this website, carry on it
I not to mention my friends came checking the great information and facts located on your web blog then immediately I got a terrible feeling I had not thanked you for them. These young men were definitely as a result glad to learn them and have in effect very much been enjoying them. I appreciate you for actually being quite thoughtful as well as for making a decision on varieties of notable subject areas most people are really wanting to understand about. My very own honest apologies for not saying thanks to you earlier.
Hey! This post couldn’t be written any better! Reading this post reminds me of my old room mate! He always kept talking about this. I will forward this write-up to him. Fairly certain he will have a good read. Thanks for sharing!
Heya i’m for the first time here. I found this board and I find It truly useful & it helped me out a lot. I hope to give something back and aid others like you aided me.
I am glad to be a visitor of this stark site! , thankyou for this rare information! .
hi!,I really like your writing very much! share we be in contact extra approximately your article on AOL? I need a specialist in this house to resolve my problem. Maybe that is you! Looking forward to see you.
fantastic post.Never knew this, regards for letting me know.
I really like your writing style, superb info , appreciate it for putting up : D.
You are a very bright individual!
Terrific work! This is the type of info that should be shared around the internet. Shame on Google for not positioning this post higher! Come on over and visit my website . Thanks =)
Some genuinely select blog posts on this internet site, saved to my bookmarks.
My brother recommended I might like this blog. He was entirely right. This post actually made my day. You cann’t imagine just how much time I had spent for this info! Thanks!
Would love to constantly get updated great website! .
Do you mind if I quote a few of your articles as long as I provide credit and sources back to your site? My blog is in the very same niche as yours and my visitors would truly benefit from some of the information you present here. Please let me know if this okay with you. Many thanks!
Very instructive and fantastic bodily structure of articles, now that’s user friendly (:.
My wife and i ended up being absolutely relieved when Peter managed to conclude his studies via the precious recommendations he grabbed from your web site. It is now and again perplexing just to happen to be handing out concepts that many other folks may have been selling. We know we now have the website owner to appreciate for that. The most important illustrations you have made, the easy blog menu, the relationships you will make it possible to engender – it’s mostly remarkable, and it is leading our son in addition to the family reckon that the subject matter is thrilling, and that is incredibly indispensable. Thank you for the whole lot!
You have brought up a very superb details, thanks for the post.
I haven’t checked in here for a while since I thought it was getting boring, but the last several posts are great quality so I guess I will add you back to my everyday bloglist. You deserve it my friend 🙂
Great line up. We will be linking to this great article on our site. Keep up the good writing.
Pretty great post. I simply stumbled upon your blog and wished to say that I’ve truly enjoyed surfing around your weblog posts. In any case I’ll be subscribing to your rss feed and I’m hoping you write once more soon!
Very interesting information!Perfect just what I was looking for! “Music is a higher revelation than philosophy.” by Ludwig van Beethoven.
What Is Puravive? Before we delve into the various facets of the supplement, let’s start with the most important
I have been exploring for a bit for any high-quality articles or blog posts on this sort of area . Exploring in Yahoo I at last stumbled upon this website. Reading this information So i’m happy to convey that I’ve a very good uncanny feeling I discovered just what I needed. I most certainly will make sure to don’t forget this site and give it a glance on a constant basis.
Thank you for sharing superb informations. Your site is so cool. I’m impressed by the details that you have on this website. It reveals how nicely you understand this subject. Bookmarked this website page, will come back for extra articles. You, my friend, ROCK! I found just the information I already searched everywhere and simply could not come across. What a perfect web-site.
I think this is among the most significant information for me. And i am glad reading your article. But want to remark on some general things, The web site style is great, the articles is really excellent : D. Good job, cheers
Thanks for helping out, good information.
Hi! Would you mind if I share your blog with my facebook group? There’s a lot of folks that I think would really appreciate your content. Please let me know. Many thanks
I am really loving the theme/design of your blog. Do you ever run into any web browser compatibility issues? A small number of my blog readers have complained about my blog not operating correctly in Explorer but looks great in Safari. Do you have any suggestions to help fix this issue?
After all, what a great site and informative posts, I will upload inbound link – bookmark this web site? Regards, Reader.
naturally like your website but you need to take a look at the spelling on quite a few of your posts. Several of them are rife with spelling problems and I to find it very bothersome to tell the reality on the other hand I will surely come back again.
I genuinely enjoy looking at on this web site, it contains superb articles. “A man of genius has been seldom ruined but by himself.” by Samuel Johnson.
It?¦s truly a great and useful piece of information. I am satisfied that you simply shared this useful information with us. Please stay us up to date like this. Thank you for sharing.
With every little thing that appears to be developing inside this particular area, your points of view happen to be rather stimulating. Nonetheless, I beg your pardon, but I do not subscribe to your whole strategy, all be it refreshing none the less. It would seem to me that your comments are not completely justified and in actuality you are generally your self not even fully certain of your argument. In any event I did enjoy looking at it.
I have recently started a website, the information you provide on this web site has helped me tremendously. Thanks for all of your time & work.
Hiya, I’m really glad I have found this info. Today bloggers publish just about gossips and internet and this is really annoying. A good site with exciting content, that’s what I need. Thanks for keeping this web-site, I’ll be visiting it. Do you do newsletters? Can’t find it.
Do you have a spam problem on this website; I also am a blogger, and I was wanting to know your situation; we have created some nice procedures and we are looking to trade strategies with others, be sure to shoot me an email if interested.
Well I truly liked studying it. This tip procured by you is very effective for good planning.
Hi! Do you use Twitter? I’d like to follow you if that would be okay. I’m definitely enjoying your blog and look forward to new posts.
Wow! Thank you! I permanently wanted to write on my site something like that. Can I include a fragment of your post to my blog?
Simply wanna comment on few general things, The website style and design is perfect, the written content is really great. “Some for renown, on scraps of learning dote, And think they grow immortal as they quote.” by Edward Young.
Hello there, I discovered your website by way of Google at the same time as searching for a similar subject, your web site came up, it seems to be good. I have bookmarked it in my google bookmarks.
I have not checked in here for a while since I thought it was getting boring, but the last several posts are great quality so I guess I’ll add you back to my daily bloglist. You deserve it my friend 🙂
That is the best weblog for anyone who desires to find out about this topic. You notice a lot its virtually laborious to argue with you (not that I actually would want…HaHa). You undoubtedly put a brand new spin on a topic thats been written about for years. Great stuff, just great!
The next time I learn a blog, I hope that it doesnt disappoint me as much as this one. I imply, I do know it was my choice to read, however I truly thought youd have one thing interesting to say. All I hear is a bunch of whining about something that you can repair if you werent too busy in search of attention.
Hey there, You have done an incredible job. I’ll definitely digg it and in my view suggest to my friends. I am confident they will be benefited from this website.
Have you ever considered publishing an e-book or guest authoring on other sites? I have a blog based upon on the same topics you discuss and would love to have you share some stories/information. I know my audience would value your work. If you’re even remotely interested, feel free to send me an e mail.
I couldn’t resist commenting
There are certainly a whole lot of particulars like that to take into consideration. That may be a nice point to bring up. I provide the ideas above as basic inspiration but clearly there are questions just like the one you carry up the place the most important factor can be working in honest good faith. I don?t know if finest practices have emerged round issues like that, however I am sure that your job is clearly identified as a fair game. Each girls and boys feel the impact of just a moment’s pleasure, for the rest of their lives.
Hello, you used to write excellent, but the last several posts have been kinda boring… I miss your tremendous writings. Past few posts are just a little bit out of track! come on!
Howdy! Would you mind if I share your blog with my twitter group? There’s a lot of people that I think would really enjoy your content. Please let me know. Thanks
Prostadine is a 100 natural supplement that helps in ensuring that your prostate remains healthy and functions optimally even as you age. It also helps in reducing symptoms like frequent urination, weak urine stream and urine leakage. With its easy-to-use dropper, you can maintain proper prostate health without any hassle and ensure that you enjoy a healthy life even as you grow older.
You should take part in a contest for one of the best blogs on the web. I will recommend this site!
Sight Care is a 100 natural and safe supplement that was developed after many years of studies by the best scientists, made to solve the nutritional deficiencies of our eyes, rejuvenating and restoring our perfect vision.
Emperor’s Vigor Tonic is a clinically researched natural male health formula that contains a proprietary blend of carefully selected ingredients. It contains minerals and essential nutrients that improve blood circulation and enhance overall health. The Emperor’s Vigor Tonic energy booster supports male health by addressing a specific enzyme in your body that can boost blood flow and nitric oxide production.
What¦s Going down i am new to this, I stumbled upon this I have discovered It absolutely helpful and it has helped me out loads. I’m hoping to contribute & aid different customers like its aided me. Great job.
CEREBROZEN aims to improve your hearing naturally. By taking drops of CEREBROZEN’s highly concentrated liquid formula daily, you can purportedly support healthy hearing and boost overall ear health.
Really excellent info can be found on web site.
I’ve recently started a blog, the info you provide on this web site has helped me greatly. Thanks for all of your time & work.
You made some good points there. I looked on the internet for the subject and found most guys will go along with with your blog.
Hello. magnificent job. I did not expect this. This is a excellent story. Thanks!
Hello there! Do you use Twitter? I’d like to follow you if that would be ok. I’m undoubtedly enjoying your blog and look forward to new updates.
Having read this I thought it was very informative. I appreciate you taking the time and effort to put this article together. I once again find myself spending way to much time both reading and commenting. But so what, it was still worth it!
I¦ve recently started a website, the information you offer on this site has helped me greatly. Thank you for all of your time & work.
Hmm is anyone else having problems with the pictures on this blog loading? I’m trying to figure out if its a problem on my end or if it’s the blog. Any suggestions would be greatly appreciated.
Good day! Would you mind if I share your blog with my twitter group? There’s a lot of folks that I think would really appreciate your content. Please let me know. Thanks
I am constantly looking online for ideas that can aid me. Thanks!
You made certain fine points there. I did a search on the matter and found nearly all persons will consent with your blog.
I was very pleased to find this web-site.I wanted to thanks for your time for this wonderful read!! I definitely enjoying every little bit of it and I have you bookmarked to check out new stuff you blog post.
I’ve been absent for some time, but now I remember why I used to love this blog. Thank you, I will try and check back more frequently. How frequently you update your site?
What i don’t realize is if truth be told how you’re now not really much more well-appreciated than you may be now. You are very intelligent. You understand therefore significantly relating to this topic, produced me in my opinion believe it from a lot of various angles. Its like women and men aren’t involved except it’s something to do with Woman gaga! Your individual stuffs nice. Always maintain it up!
You have brought up a very great points, appreciate it for the post.
I’m curious to find out what blog system you’re utilizing? I’m experiencing some minor security issues with my latest site and I’d like to find something more risk-free. Do you have any solutions?
Thank you for your entire work on this blog. Kate loves setting aside time for research and it is easy to understand why. We all know all of the compelling tactic you produce functional guidelines on the blog and in addition improve participation from the others about this concern while our simple princess is in fact understanding a lot. Take pleasure in the remaining portion of the new year. You’re performing a very good job.
I like this weblog very much, Its a rattling nice place to read and obtain information.
I’m still learning from you, but I’m trying to achieve my goals. I absolutely enjoy reading everything that is written on your website.Keep the aarticles coming. I liked it!
Lottery Defeater Software is a digital tool designed to assist individuals in improving their chances of winning in various lotteries.
Ikaria Lean Belly Juice is a fast-acting weight loss supplement that is developed to incinerate stubborn fat.
F*ckin’ remarkable issues here. I’m very glad to see your article. Thanks so much and i’m looking ahead to touch you. Will you kindly drop me a mail?
Fantastic site. A lot of useful info here. I am sending it to a few friends ans also sharing in delicious. And certainly, thanks for your sweat!
I reckon something truly special in this internet site.
I’ve read a few good stuff here. Certainly price bookmarking for revisiting. I surprise how so much attempt you put to create any such excellent informative site.
of course like your website but you need to test the spelling on quite a few of your posts. A number of them are rife with spelling problems and I in finding it very bothersome to tell the reality then again I will surely come back again.
obviously like your web-site but you have to test the spelling on quite a few of your posts. Several of them are rife with spelling problems and I in finding it very troublesome to tell the truth however I will definitely come again again.
When I initially commented I clicked the -Notify me when new feedback are added- checkbox and now each time a comment is added I get 4 emails with the identical comment. Is there any way you can take away me from that service? Thanks!
Today, I went to the beachfront with my kids. I found a sea shell and gave it to my 4 year old daughter and said “You can hear the ocean if you put this to your ear.” She put the shell to her ear and screamed. There was a hermit crab inside and it pinched her ear. She never wants to go back! LoL I know this is totally off topic but I had to tell someone!
so much wonderful information on here, : D.
Having read this I thought it was very informative. I appreciate you taking the time and effort to put this article together. I once again find myself spending way to much time both reading and commenting. But so what, it was still worth it!
I really appreciate this post. I’ve been looking everywhere for this! Thank goodness I found it on Bing. You have made my day! Thx again
This website is my inspiration , really fantastic pattern and perfect written content.
Regards for all your efforts that you have put in this. very interesting information.
I went over this internet site and I conceive you have a lot of excellent info, saved to favorites (:.
What i do not understood is in fact how you’re no longer really much more neatly-liked than you might be now. You’re so intelligent. You already know thus considerably in relation to this topic, made me individually imagine it from so many various angles. Its like men and women are not fascinated unless it is one thing to accomplish with Girl gaga! Your personal stuffs excellent. At all times deal with it up!
Very interesting topic, thanks for posting.
When I originally commented I clicked the -Notify me when new comments are added- checkbox and now each time a comment is added I get four emails with the same comment. Is there any way you can remove me from that service? Thanks!
Spot on with this write-up, I really suppose this web site wants rather more consideration. I’ll in all probability be again to learn much more, thanks for that info.
Hi, Neat post. There’s an issue along with your web site in internet explorer, may test thisK IE nonetheless is the market leader and a big portion of other folks will miss your great writing due to this problem.
he blog was how do i say it… relevant, finally something that helped me. Thanks
Fantastic goods from you, man. I’ve be aware your stuff previous to and you’re just extremely magnificent. I actually like what you have received right here, really like what you’re saying and the way in which during which you assert it. You are making it enjoyable and you still care for to stay it sensible. I cant wait to learn far more from you. That is actually a terrific web site.
My developer is trying to convince me to move to .net from PHP. I have always disliked the idea because of the costs. But he’s tryiong none the less. I’ve been using WordPress on numerous websites for about a year and am concerned about switching to another platform. I have heard excellent things about blogengine.net. Is there a way I can transfer all my wordpress posts into it? Any help would be greatly appreciated!
I?¦ve recently started a blog, the info you provide on this web site has helped me greatly. Thank you for all of your time & work.
Wow! Thank you! I continually wanted to write on my site something like that. Can I implement a part of your post to my blog?
You are my breathing in, I own few blogs and very sporadically run out from brand :). “Truth springs from argument amongst friends.” by David Hume.
I was very happy to search out this web-site.I wished to thanks in your time for this wonderful learn!! I undoubtedly enjoying every little little bit of it and I have you bookmarked to check out new stuff you weblog post.
magnificent points altogether, you simply gained a new reader. What would you suggest about your post that you made a few days ago? Any positive?
You made a few fine points there. I did a search on the matter and found most persons will go along with with your blog.
I enjoy the efforts you have put in this, thankyou for all the great blog posts.
obviously like your web-site however you need to test the spelling on quite a few of your posts. A number of them are rife with spelling problems and I in finding it very bothersome to tell the truth nevertheless I will surely come back again.
It is appropriate time to make a few plans for the future and it is time to be happy. I have learn this submit and if I may I wish to recommend you some attention-grabbing things or advice. Maybe you can write subsequent articles relating to this article. I wish to learn even more issues about it!
Do you have a spam issue on this website; I also am a blogger, and I was wanting to know your situation; we have developed some nice practices and we are looking to swap strategies with other folks, be sure to shoot me an email if interested.
Hello my loved one! I want to say that this article is awesome, nice written and include almost all vital infos. I would like to look more posts like this.
This blog is definitely rather handy since I’m at the moment creating an internet floral website – although I am only starting out therefore it’s really fairly small, nothing like this site. Can link to a few of the posts here as they are quite. Thanks much. Zoey Olsen
The subsequent time I read a blog, I hope that it doesnt disappoint me as much as this one. I imply, I do know it was my choice to read, however I really thought youd have one thing fascinating to say. All I hear is a bunch of whining about one thing that you could possibly repair should you werent too busy looking for attention.
Puravive is a natural weight loss supplement and is said to be quite effective in supporting healthy weight loss.
Hmm is anyone else having problems with the images on this blog loading? I’m trying to figure out if its a problem on my end or if it’s the blog. Any suggestions would be greatly appreciated.
Your place is valueble for me. Thanks!…
This really answered my problem, thank you!
Renew: An OverviewRenew is a dietary supplement that is formulated to help in the weight loss process.
I’m usually to blogging and i actually recognize your content. The article has really peaks my interest. I’m going to bookmark your site and maintain checking for brand spanking new information.
Some genuinely superb posts on this web site, appreciate it for contribution.
A powerful share, I simply given this onto a colleague who was doing just a little analysis on this. And he the truth is bought me breakfast as a result of I discovered it for him.. smile. So let me reword that: Thnx for the treat! But yeah Thnkx for spending the time to discuss this, I really feel strongly about it and love reading extra on this topic. If potential, as you turn into experience, would you mind updating your weblog with extra details? It’s extremely useful for me. Massive thumb up for this blog put up!
I gotta bookmark this site it seems very helpful handy
I’m still learning from you, as I’m trying to achieve my goals. I certainly liked reading everything that is written on your site.Keep the information coming. I loved it!
I am not rattling excellent with English but I get hold this really easygoing to read .
I think this is among the most important information for me. And i’m glad reading your article. But want to remark on few general things, The web site style is great, the articles is really great : D. Good job, cheers
Very interesting information!Perfect just what I was searching for!
This post is a wonderful tribute to a beautiful Monday. Your insights are as refreshing as the day itself. Adding more visuals could enrich the experience for visual learners like myself.
I really like your writing style, fantastic information, regards for posting : D.
Really great visual appeal on this internet site, I’d value it 10 10.
Hello my family member! I want to say that this article is awesome, great written and come with almost all significant infos. I?¦d like to look more posts like this .
Irontech Doll ここで素晴らしいこと。あなたの記事を見てとてもうれしいです。例として美しいラブドールを取り上げます。それはあなたが他のいくつかの変種に加えて、最高のものとして、あなたがセックス人形で得ることができるものに適用されます。彼女は完璧に見え、人生と人生に忠実で、素晴らしい骨格を持っており、彼女の口腔機能(および他の変種)は最高です。
YourDoll JP 男はダッチワイフを購入することについて恥ずかしいはずですか?11ヒントあなたのダッチワイフに本当に集中するための最良の方法あなたのすべての性的固定を愛情人形で満たしてくださいなぜあなたはhotsexydolls.comからダッチワイフを購入する必要がありますか?
Hello.This post was really fascinating, particularly since I was looking for thoughts on this topic last Saturday.
Hello, Neat post. There is a problem with your website in web explorer, may check thisK IE nonetheless is the marketplace leader and a huge portion of people will pass over your wonderful writing due to this problem.
Oh my goodness! a tremendous article dude. Thanks Nonetheless I am experiencing problem with ur rss . Don’t know why Unable to subscribe to it. Is there anybody getting equivalent rss problem? Anybody who is aware of kindly respond. Thnkx
I reckon something truly special in this site.
I enjoy your writing style really loving this site.
You are my aspiration, I have few web logs and infrequently run out from post :). “Analyzing humor is like dissecting a frog. Few people are interested and the frog dies of it.” by E. B. White.
Hello! Do you use Twitter? I’d like to follow you if that would be okay. I’m undoubtedly enjoying your blog and look forward to new updates.
Someone essentially lend a hand to make seriously posts I’d state. This is the very first time I frequented your website page and to this point? I surprised with the research you made to create this actual publish extraordinary. Excellent process!
Thanks for some other excellent article. Where else may just anybody get that type of information in such a perfect manner of writing? I’ve a presentation next week, and I’m on the look for such information.
The subsequent time I read a blog, I hope that it doesnt disappoint me as a lot as this one. I imply, I do know it was my option to read, but I truly thought youd have something fascinating to say. All I hear is a bunch of whining about one thing that you might repair in the event you werent too busy looking for attention.
I simply had to say thanks all over again. I am not sure the things I would have achieved in the absence of these thoughts provided by you regarding that subject matter. It was actually a real troublesome circumstance in my view, but observing this skilled form you managed the issue made me to cry for delight. Now i’m grateful for the assistance and thus have high hopes you are aware of a great job your are undertaking instructing some other people with the aid of your blog post. I am certain you haven’t met all of us.
FitSpresso is a weight loss supplement designed for individuals dealing with stubborn body fat.
Saved as a favorite, I really like your blog!
You could certainly see your expertise in the paintings you write. The sector hopes for more passionate writers such as you who are not afraid to mention how they believe. At all times follow your heart. “We are near waking when we dream we are dreaming.” by Friedrich von Hardenberg Novalis.
Super-Duper website! I am loving it!! Will be back later to read some more. I am taking your feeds also.
Heya are using WordPress for your blog platform? I’m new to the blog world but I’m trying to get started and set up my own. Do you require any html coding knowledge to make your own blog? Any help would be really appreciated!
Your home is valueble for me. Thanks!…
I think other web-site proprietors should take this web site as an model, very clean and great user genial style and design, as well as the content. You’re an expert in this topic!
Awsome site! I am loving it!! Will be back later to read some more. I am bookmarking your feeds also
Very interesting points you have observed, thankyou for putting up. “I don’t know what you could say about a day in which you have seen four beautiful sunsets.” by John Glenn.
Someone necessarily lend a hand to make seriously posts I would state. That is the very first time I frequented your web page and to this point? I surprised with the analysis you made to create this particular put up amazing. Magnificent task!
Hello there! Do you use Twitter? I’d like to follow you if that would be ok. I’m absolutely enjoying your blog and look forward to new posts.
Thanks a bunch for sharing this with all of us you actually know what you are talking about! Bookmarked. Kindly also visit my website =). We could have a link exchange agreement between us!
Hmm it appears like your blog ate my first comment (it was super long) so I guess I’ll just sum it up what I wrote and say, I’m thoroughly enjoying your blog. I too am an aspiring blog blogger but I’m still new to the whole thing. Do you have any helpful hints for newbie blog writers? I’d genuinely appreciate it.